Physical Address
304 North Cardinal St.
Dorchester Center, MA 02124
Physical Address
304 North Cardinal St.
Dorchester Center, MA 02124

Opening your DNA test results for the first time can feel like standing at the edge of an ocean of genetic connections. Thousands of matches stare back at you, each one representing a potential branch of your family tree waiting to be explored. Learning how to organise your DNA matches effectively transforms this overwhelming flood of data into a clear roadmap for discovering your ancestral heritage.
The key to success lies in understanding the language of genetic genealogy. Before diving into the organization process, you need to grasp fundamental concepts like centimorgans, shared DNA segments, and relationship probabilities. These building blocks will help you prioritize which matches deserve your immediate attention and which can wait for later exploration.
This comprehensive guide walks you through a proven three-step system for organizing your DNA matches. By the end, you will have a structured approach to categorizing connections, analyzing genetic networks, and communicating with relatives. Whether you are solving a family mystery or simply curious about your heritage, these methods will help you extract maximum value from your genetic data.
When you first access your DNA match list, the sheer volume of names and numbers can feel paralyzing. Most testing platforms display your matches in descending order by shared DNA amount, but simply knowing that two people share genetic material does not tell you how they connect to your family tree. Systematic organization begins with understanding what these numbers actually mean.
Centimorgans, abbreviated as cM, serve as the fundamental unit of measurement in genetic genealogy. This metric quantifies how much DNA you share with any given match, which directly correlates to how closely related you likely are. Think of centimorgans as the genetic distance between two people—the higher the number, the closer the biological relationship.
Most DNA testing companies display shared centimorgans prominently on each match’s profile page. For detailed cM ranges for various relationships, see our guide on DNA sharing amounts between relatives. Understanding these ranges helps you prioritize your research efforts effectively.
Here is a reference table showing typical cM ranges for common relationships:
| Relationship | Shared cM Range | Average cM |
|---|---|---|
| Parent/Child | 3,300-3,700 | 3,475 |
| Full Sibling | 2,200-3,300 | 2,550 |
| Half Sibling | 1,300-2,100 | 1,750 |
| Grandparent | 1,300-2,300 | 1,750 |
| First Cousin | 500-1,450 | 850 |
| First Cousin Once Removed | 220-680 | 430 |
| Second Cousin | 75-360 | 230 |
| Second Cousin Once Removed | 30-215 | 120 |
| Third Cousin | 0-180 | 75 |
| Distant Cousin (4th-8th) | 6-50 | 25 |
These ranges represent typical values, but actual shared DNA can vary due to random inheritance patterns. The Shared Centimorgans Project data provides comprehensive probability ranges based on thousands of documented relationships. Remember that segments smaller than 7 cM may be identical by chance rather than by descent, so focus initially on matches sharing at least 20-30 cM for reliable genealogical connections.
The Leeds Method, developed by Dana Leeds, provides a systematic approach for clustering your DNA matches into genetic networks based on shared ancestry. This technique works particularly well for individuals with approximately 100 to 400 matches sharing 90 cM or more. The method helps you identify which matches belong to which ancestral lines without needing extensive family trees.
Here is how to implement the Leeds Method step by step. First, create a spreadsheet with columns for match names, shared cM amounts, and known relationships. Sort your matches by shared DNA, focusing initially on those sharing 90-400 cM. These represent roughly second to fourth cousin relationships—close enough to be meaningful but distant enough to provide useful clustering data.
Next, identify your second cousins or closer relatives whose connections you already know. These become your anchor matches. For example, if you have a known second cousin on your maternal grandmother’s side, note this in your spreadsheet. Now examine which other matches share DNA with this known cousin but not with your other known cousins. These matches likely connect to the same ancestral line.
Color code each ancestral line using the spreadsheet highlighting feature. Assign one color to your paternal grandfather’s line, another to your paternal grandmother’s line, and so forth. As you work through your match list, patterns emerge. Matches who share DNA with multiple colored anchors may indicate intermarriage between family lines or pedigree collapse in your ancestry.
Beyond the Leeds Method, most DNA testing platforms offer built-in tools for organizing matches. AncestryDNA provides colored dot systems that allow you to assign visual markers to matches based on their ancestral lines. MyHeritage offers similar grouping features with their DNA Match labels. Understanding the best DNA testing platforms helps you leverage these platform-specific capabilities effectively.
Develop a consistent color coding system that works across all platforms. Many genealogists use warm colors (red, orange, yellow) for paternal lines and cool colors (blue, green, purple) for maternal lines. Within each side, assign specific colors to each grandparent’s ancestry. For example, red might represent your paternal grandfather, orange your paternal grandmother, blue your maternal grandfather, and green your maternal grandmother.
Apply these colors systematically as you identify connections. When you determine that a match belongs to your paternal grandmother’s line, mark them with orange across all platforms where you find them. This visual consistency helps you quickly recognize patterns when browsing your match lists. Over time, your color-coded system creates an intuitive map of your genetic network.
Organizing DNA matches into meaningful categories requires understanding the concept of genetic networks. A genetic network, or cluster, consists of matches who share DNA with each other, indicating they likely descend from common ancestors. By grouping matches into these networks, you can work on multiple related individuals simultaneously rather than investigating each match in isolation.
Begin by creating broad categories based on relationship closeness. Close relatives share more than 200 cM and typically represent immediate family through second cousins. These matches deserve immediate attention because they offer the clearest path to recent ancestors. Medium matches share 50-200 cM and usually represent third cousins or closer. These matches often provide the best balance between researchability and genealogical value.
Distant matches sharing less than 50 cM require careful evaluation. While they may represent fourth cousins or more distant relationships, they can also be false positives or matches from endogamous populations where multiple ancestral lines intertwine. Create a separate category for these matches and revisit them once you have established your closer connections.
Within each category, organize matches by the amount of shared DNA in descending order. This prioritization ensures you focus energy on matches most likely to yield breakthrough discoveries. Keep a research log noting which matches you have contacted, what information you have shared, and any breakthroughs achieved. Documentation prevents redundant efforts and helps track your progress over time.
Also Read: What is DNA Ethnicity Estimates? Learn Your Heritage
Once you have categorized your DNA matches into genetic networks, the real detective work begins. Analyzing connections involves identifying the Most Recent Common Ancestor, or MRCA, that you share with each match. This ancestor represents the point where your family tree intersects with your match’s family tree. Finding these intersection points transforms random genetic matches into meaningful genealogical discoveries.
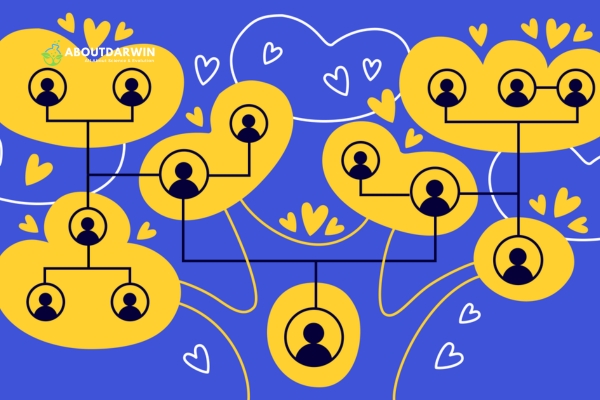
Discovering shared ancestors represents the central goal of genetic genealogy. When you identify that John Smith from your DNA match list is actually a third cousin through your paternal great-grandfather, you have successfully mapped a genetic connection to a specific ancestral line. This process requires comparing family trees, examining shared surnames, and identifying common geographical locations.
Begin by examining each match’s public family tree if available. Look for surnames that appear in your own research, particularly those from the generation where your estimated relationship would place the common ancestor. If your shared DNA suggests a third cousin relationship, look at your great-great-grandparents’ lines. For second cousins, examine your great-grandparents’ descendants.
Geographical clustering provides another powerful clue. If multiple matches share DNA with each other and all have ancestors from the same small town or county, you have likely identified a genetic network connected to that location. Cross-reference these findings with census records, vital records, and immigration documents to confirm the connection. Ancestry’s ThruLines tool can help identify potential common ancestors automatically through DNA matches and existing trees.
Several specialized tools enhance your ability to analyze DNA matches and build accurate family trees. DNA Painter stands out as an essential resource for chromosome mapping, allowing you to visualize exactly which segments of DNA you inherited from specific ancestors. Advanced users can use DNA Painter for chromosome mapping to confirm ancestral lines and identify unknown parentage scenarios.
Chromosome browsers provided by platforms like MyHeritage, Family Tree DNA, and GEDmatch show you the specific segments where you and your matches share DNA. This visualization helps identify triangulated segments—areas where three or more matches share the same DNA segment, strongly indicating descent from a common ancestor. Triangulation provides powerful evidence for confirming genealogical relationships beyond simple matching.
The WATO tool, or What Are The Odds, helps calculate relationship probabilities when you have multiple DNA matches descended from the same ancestor. By entering shared cM amounts and known family structures, WATO generates probability charts showing which relationships are most likely. This statistical approach proves invaluable when dealing with complex family situations or multiple generations of unknown parentage.
For unknown parentage research, mirror trees provide a specialized technique. A mirror tree involves building a research tree around a close DNA match’s known ancestry, then using that tree to identify potential common ancestors. For unknown parentage cases, mirror trees can help organize matches around potential ancestral lines when traditional research methods hit dead ends.
When you successfully identify one connection within a genetic network, the benefits cascade throughout your entire match list. Organizing one relationship often illuminates several others because matches who share DNA with each other typically share common ancestors. This ripple effect transforms isolated discoveries into comprehensive ancestral maps.
As you identify MRCAs for individual matches, revisit your Leeds Method spreadsheet or color-coded system. Update each match’s entry with the confirmed ancestor. Over time, you will notice that entire clusters resolve into specific family lines. What once seemed like a random collection of strangers becomes an organized network of cousins, each connected through documented ancestral pathways.
This organized approach proves particularly valuable when breaking through brick walls in your research. If you have been stuck on a particular ancestor for years, DNA matches from that line may provide the missing link. Even distant cousins can offer family documents, photographs, or oral histories that never made it into official records. The systematic organization of your matches ensures you can quickly identify which connections might help solve specific research problems.
Also Read: How to Get DNA Matches Without Trees? [Expert Guide]
After organizing and analyzing your DNA matches, the final step involves reaching out to these genetic relatives. Successful communication requires tact, clarity, and respect for privacy boundaries. Remember that not all DNA testers are interested in genealogy, and some may have taken tests solely for ethnicity estimates or health information. Approach each contact with sensitivity to these different motivations.
Crafting an effective initial message to DNA matches requires balancing informativeness with brevity. Start with a friendly introduction mentioning your name and that you appear as DNA matches. Keep your first message concise—two to three sentences typically work best. Long messages may overwhelm recipients or appear overly demanding.
Include specific details that demonstrate you have done your research. Mention the shared cM amount, any shared matches you have identified, or surnames you suspect might connect your families. This specificity shows you are a serious researcher rather than someone sending generic messages to hundreds of matches. If you both have Great Aunt Mildred appearing in your trees, mention this common ancestor explicitly.
Respect privacy considerations by never sharing personal details about living people without permission. If you have discovered sensitive information, such as misattributed parentage or adoption, approach the topic with extreme care. Some DNA testers may be unaware of their biological parentage, and your message might reveal unexpected family situations. Always prioritize the emotional wellbeing of your matches over your research curiosity.
Once you have established initial contact, focus on collaborative information sharing. Offer to exchange family tree information, photographs, or documents that might help both parties extend their research. Frame your requests as mutual exchanges rather than one-sided information gathering. People respond more positively when they perceive value for themselves in the interaction.
Ask open-ended questions about family history, migration patterns, or family stories. These prompts often yield rich information that does not appear in official records. A match might remember hearing that their great-grandmother came from a particular village, or that there was a falling out between siblings that explains why branches lost contact. These oral histories add invaluable context to your genetic discoveries.
Document all communications in your research log, noting dates, information shared, and any breakthroughs achieved. This documentation helps prevent asking the same questions twice and allows you to follow up appropriately after reasonable time intervals. Some matches may need months to respond, particularly if they are dealing with sensitive discoveries of their own.
Effective DNA match organization requires ongoing maintenance. Testing companies regularly add new matches as more people test, and existing matches sometimes update their trees or ethnic backgrounds. Set aside time monthly to review your match list for new high-value connections and to check for updates from matches you have previously contacted.
Update your spreadsheets, color coding, and research logs as new information emerges. When Aunt Betty remembers Uncle Joe’s second wife’s name after her weekly bingo game, add this detail to your records immediately. Small pieces of information often connect to larger discoveries when viewed in the context of your organized genetic network.
Share new discoveries with matches who have contributed to your research. When you break through a brick wall or identify a new common ancestor, let your genetic cousins know. This continued engagement keeps relationships active and encourages future collaboration. Clear communication and cooperation turn random DNA matches into a supportive community of researchers working together to uncover shared heritage.
Also Read: DNA Matches Aren’t Related? What Does That Mean?
Understanding the available tools for DNA analysis helps you choose the right platforms for your specific research goals. Different testing companies and third-party tools offer varying features for match organization, clustering, and chromosome analysis. Here is a comparison of the major platforms and their organizational capabilities.
| Platform | Clustering Features | Chromosome Browser | Tree Integration | Best For |
|---|---|---|---|---|
| AncestryDNA | Custom groups, colored dots | No | Excellent | Large database, tree building |
| MyHeritage | AutoClusters, labels | Yes | Good | International matches, chromosome mapping |
| Family Tree DNA | Matrix tool | Yes | Moderate | Y-DNA/mtDNA testing, advanced analysis |
| 23andMe | DNA Relatives filters | Yes (limited) | Limited | Health insights, ethnicity |
| GEDmatch | AutoCluster Tier 1 | Yes | Optional | Cross-platform comparison |
AutoClustering tools revolutionize DNA match organization by automatically grouping your matches into genetic networks. These tools analyze which of your matches share DNA with each other and create visual cluster maps showing the relationships. Genetic Affairs offers AutoClustering for multiple platforms, while MyHeritage provides built-in AutoClusters for DNA customers.
These automated tools save significant time compared to manual clustering methods like the Leeds Method. Instead of manually comparing shared matches one by one, AutoClustering algorithms process hundreds or thousands of matches simultaneously. The resulting visualizations show colored clusters, with each color representing a different ancestral line or family network.
GEDmatch Tier 1 subscribers gain access to the platform’s AutoCluster tool, which works across uploads from multiple testing companies. This cross-platform capability proves invaluable when you have tested with multiple companies or uploaded data from relatives who tested elsewhere. DNAGedcom provides additional clustering and analysis tools specifically designed for power users managing large match lists.
Individuals from endogamous populations face unique challenges when organizing DNA matches. Endogamy occurs when populations intermarry over many generations, such as in Ashkenazi Jewish, French Canadian, or isolated island communities. In these cases, you may share DNA with distant cousins through multiple ancestral lines, making simple clustering methods less effective.
When working with endogamous ancestry, focus on larger shared segments rather than total shared cM. Segments over 20 cM likely represent more recent common ancestry, while smaller segments may reflect distant population-wide sharing. The Leeds Method requires modification for endogamous populations, typically using higher cM thresholds to identify meaningful clusters.
Sometimes DNA testing reveals unexpected family situations, including non-paternal events or misattributed parentage. These discoveries require sensitive handling and may necessitate adjusting your organization strategy. When you discover that a close match does not fit your documented tree, take time to verify the results before drawing conclusions.
Create separate organizational categories for matches whose relationships remain uncertain. Work through these matches methodically, looking for clusters that might represent unknown biological lines. Remember that genealogical surprises, while initially shocking, often lead to expanded family networks and rich new branches of your family tree.
Absolutely. Always respect privacy by initiating contact considerately, and never share personal details about living people without permission. Be particularly sensitive when contacting matches who may be unaware of adoption, donor conception, or other family situations revealed through DNA testing. Let matches control how much information they wish to share.
Start with matches sharing the most DNA, typically over 90 cM, as they represent closer relationships with the greatest potential for immediate genealogical insights. Use the centimorgan relationship table to estimate likely relationships, then focus on matches whose positions in your tree you can already partially deduce. Work systematically from close relatives outward to distant cousins.
The Leeds Method is a systematic approach for clustering DNA matches by creating a spreadsheet of matches sharing 90-400 cM, then identifying which matches share DNA with your known relatives. Color code matches based on which known cousins they connect to, revealing genetic networks organized by ancestral line. This method works particularly well for individuals with approximately 100 to 400 matches in this cM range.
AutoClustering tools like Genetic Affairs and MyHeritage AutoClusters automatically analyze which of your matches share DNA with each other, then generate visual cluster maps showing genetic networks. Each colored cluster represents matches likely descended from common ancestors. These tools save significant time compared to manual clustering methods and can process thousands of matches simultaneously.
Approach unexpected matches with an open mind and verify results before drawing conclusions. Create separate organizational categories for uncertain relationships and work through them methodically using clustering methods. Be sensitive when contacting matches who may reveal unknown parentage or adoption situations. Remember that surprises often lead to expanded family networks.
First cousins typically share between 500 and 1,450 centimorgans, with an average of approximately 850 cM. This range can vary due to random inheritance patterns. First cousins once removed usually share 220-680 cM, while second cousins share roughly 75-360 cM. Use these ranges to estimate relationship probabilities when analyzing your DNA matches.
GEDmatch allows cross-platform comparison by uploading DNA data from any major testing company. DNA Painter helps visualize chromosome segments from matches across platforms. Genetic Affairs provides AutoClustering for multiple databases. Spreadsheets remain essential for tracking matches from different sources in one organized location.
Mastering how to organise your DNA matches transforms genetic data from overwhelming chaos into structured genealogical discovery. By understanding centimorgans and relationship probabilities, implementing systematic clustering through the Leeds Method, and leveraging modern AutoClustering tools, you create a framework for uncovering your ancestral heritage. The three-step process of categorizing, analyzing, and communicating with matches provides a repeatable system for ongoing research success.
Remember that DNA match organization is not a one-time task but an ongoing journey. New matches appear regularly as more people test, and each new connection potentially reveals dozens of additional relatives through shared match networks. Maintain your spreadsheets, update your color coding systems, and continue refining your organizational approach as your genetic family tree expands.
The satisfaction of piecing together your family’s past through genetic connections remains unmatched in genealogical research. Each organized match represents a potential story, photograph, or family tradition waiting to be discovered. Start with your closest matches today, apply these systematic methods, and watch as your DNA match list transforms from a confusing list of strangers into a vibrant network of cousins and shared heritage. Your ancestral adventure awaits.
Also Read: Discover Top Genealogy Tools to Trace Your Family History