Physical Address
304 North Cardinal St.
Dorchester Center, MA 02124
Physical Address
304 North Cardinal St.
Dorchester Center, MA 02124

When you open your DNA test results and see surprising percentages, one question immediately comes to mind: can your child have more ethnicity than you? This scenario happens more often than people realize, and the explanation lies in the fascinating mechanics of genetic inheritance. The complexity of DNA recombination means ethnicity estimates can vary significantly between parents and children, sometimes showing patterns that seem mathematically impossible at first glance.
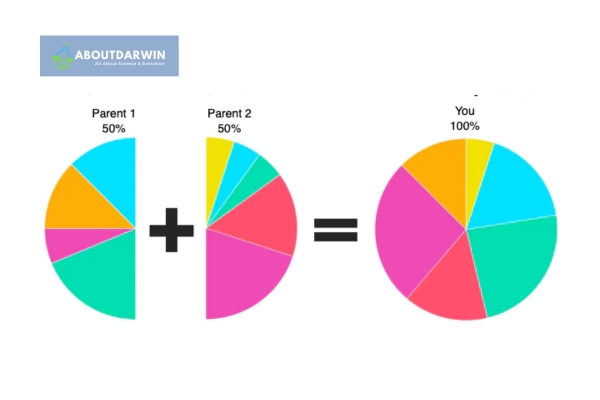
The short answer involves understanding how genetic material shuffles during conception. While children inherit exactly 50% of their DNA from each parent, the specific segments passed down are randomly selected through a process called chromosomal crossover. This genetic lottery means a child might receive more DNA segments associated with a particular ethnicity than either parent individually exhibits in their test results, creating the illusion of “more” ancestry.
In 2026, with millions of people taking DNA tests from companies like AncestryDNA, 23andMe, and MyHeritage, questions about unexpected ethnicity results have become increasingly common. Understanding the science behind these variations helps explain why your results might differ from your parents and why siblings can show completely different ancestral breakdowns despite sharing the same family tree.
To understand how a child can potentially have more ethnicities than their parents, we must first clearly define three essential terms: ethnicity, race, and genetic ancestry. These concepts are often used interchangeably in everyday conversation, but they represent distinctly different aspects of human identity and biology.
Notably, while genetic ancestry might incline us toward certain potential physical traits or preconditions related to health issues (like propensity for specific diseases), it does not dictate one’s ethnicity nor guarantee that these potentialities will manifest. On the other hand, your selected ethnicity might not completely mirror your genetic makeup due to the influence of environment, upbringing, and personal identification.
The extraordinary intricacy of human genetics ensures that each person is truly unique—even identical twins have slight variations in their genomes. Here’s how children can end up with unexpected traits that reveal hidden ancestral connections:
In essence, genetics can indeed surprise us with unanticipated mixes at every generation due to its inherent complexity and variability. The random nature of inheritance means every child receives a unique combination of their parents’ genetic material.
Understanding our ethnic heritage can be a complex and exciting journey of self-discovery, often raising questions that challenge traditional understanding. One such question that frequently arises is, can a child have more ethnicity than their parents? This phenomenon, while puzzling at first, has a clear scientific explanation rooted in the mechanics of genetic inheritance.
The mathematics of DNA inheritance allows for situations where a child shows a higher percentage of a specific ethnicity than either parent individually. For example, if Parent A carries 5% Scandinavian DNA and Parent B carries 3% Scandinavian DNA, their child could theoretically inherit anywhere from 0% to 8%, with any amount above 5% appearing as “more” than one parent.
Before we dive into the science, it’s crucial to dispel some common misconceptions about ethnicity and inheritance that often cause confusion when people first receive their DNA test results.
After debunking these myths, let’s move ahead and understand how exactly genetic recombination works and why it creates such fascinating possibilities in ethnicity inheritance.
Recombination: DNA recombination during conception implies shuffling can occur, which might make some portions more visible in you than in either parent. Every person has two copies of each gene—one inherited from each parent—which then combine to determine many things, including one’s ethnic makeup. Recombination means shards of these genes get mixed up or ‘recombined’ and passed on to the next generation.
One way to understand this is by using the shuffle deck cards analogy—each card, like the mini representation gene portion, has defined characteristics. Even massive groups’ traits might correspond to ethnicity. Shuffling means some cards end up being more prominent than others in any given hand dealt to a child.
Here’s a fun fact—due to recombination, siblings (with the same parents) have almost as much genetic variation as humans broadly apart. Siblings share approximately 50% of their DNA, but the specific 50% varies dramatically between brothers and sisters. Hence, siblings can show different ethnic markers, too, sometimes leading to one child having “more” of a specific ethnicity than another despite sharing the exact same ancestral background.
To truly grasp how a child can have more ethnicity than a parent, it helps to examine concrete examples with actual percentages. These numerical illustrations demonstrate the range effect that makes surprising results possible.
Consider a scenario where Parent A has an ethnicity estimate showing 8% Irish ancestry, while Parent B shows 4% Irish ancestry. Due to the random nature of chromosomal inheritance, their child could inherit anywhere from 0% to 12% Irish DNA. If the child happens to receive 10%, they would technically have “more Irish ethnicity” than either parent individually, even though they logically cannot exceed the combined total.
Another common pattern occurs with trace ancestry. If one parent shows 2% Italian and the other shows 1% Italian, a child showing 3% or even 4% might cause confusion. However, this falls within the expected range of genetic variation. Understanding when to retake a DNA test versus when results are simply part of normal variation helps manage expectations.
The mathematics becomes even more interesting with multiple generations. A grandparent with 20% of a specific ethnicity might pass down varying amounts to their children (perhaps 8% to one, 12% to another), who then pass different amounts to their own children. This cascading randomness explains why ethnicity estimates can seem to grow or shrink across generations despite the underlying genetic reality remaining constant.
One of the most confusing aspects of DNA testing occurs when the same person receives different ethnicity estimates from different companies. Someone might show 15% Eastern European on AncestryDNA but 22% on 23andMe and 8% on MyHeritage. Understanding why these discrepancies happen helps explain the broader question of varying results between parents and children.
Each testing company maintains its own reference populations—the groups of people with known ancestry from specific regions that serve as comparison points for your DNA. AncestryDNA uses over 70,000 reference samples, while 23andMe and MyHeritage use different sets with varying sizes and compositions. If your DNA matches segments in one company’s reference panel but not another’s, your results will differ.
The algorithms each company employs also vary significantly. AncestryDNA uses a “timothy” algorithm that attempts to determine when admixture occurred, while 23andMe focuses on smoothing results across chromosomes. MyHeritage incorporates historical migration patterns into their calculations. These methodological differences mean the same genetic segments can be interpreted as belonging to different ethnic regions depending on which service analyzes them.
Reference population updates change results over time as well. AncestryDNA has released several ethnicity estimate updates since 2012, each refining their regional categories and adding more samples. A parent who tested in 2019 might have different baseline results than a child testing in 2026, not because their DNA changed, but because the interpretation methodology evolved.
When comparing parent and child results, using the same testing company helps ensure consistency in methodology. However, even within the same platform, the random inheritance patterns discussed earlier combined with algorithmic smoothing can create apparent discrepancies that reflect statistical processing rather than biological reality.
Among the most perplexing DNA test results are trace ancestry findings—those small percentages showing 1% or 2% from unexpected regions. Many people wonder whether these represent real ancestral connections or simply statistical noise from the testing process.
Trace ancestry results typically fall within the margin of error for DNA testing. Most commercial tests have a confidence threshold around 1%, meaning results below this level might reflect random genetic similarity to reference populations rather than genuine ancestral connections. However, this doesn’t mean all small percentages are meaningless—some do represent real but distant ancestry.
Statistical noise arises from the way DNA testing works. When companies compare your genetic markers to their reference populations, they look for segments that match known patterns from specific regions. Sometimes, random genetic variations create false matches, especially when dealing with genetically similar populations. A segment might match both English and German reference samples, leading to uncertainty in categorization.
The confidence intervals that companies provide help distinguish meaningful results from noise. AncestryDNA displays ranges alongside point estimates—a result showing 2% Norway might have a range of 0-5%, indicating uncertainty. When the range includes zero, the ancestry might not be biologically present despite appearing in your estimate.
For parent-child comparisons, trace results require particular caution. If a parent shows 0% of a region but their child shows 1%, this might represent statistical noise rather than hidden ancestry. However, if both parents show small amounts (1-2%) and the child shows 3-4%, the combined inheritance pattern suggests a real biological connection. Understanding how DNA sharing works across generations helps interpret these patterns.
Exploring your family tree reveals the complex patterns of migration, intermarriage, and genetic exchange that shape modern ethnicity estimates. Here are the fundamental concepts that illuminate how ancestry flows through generations:
| Factor | Description |
|---|---|
| Ancestral Roots | These refer to the geographic regions and ethnic groups from which a person’s bloodline originates. |
| DNA Recombination | This is the process of exchanging genetic material during conception, which leads to offspring inheriting a unique blend of their parents’ genes. |
| Genetic Variability | This refers to the amount of variation in the genetic makeup within a population or an individual. More diversity can lead to more visible differences in ethnicity. |
| Dominant and Recessive Genes | Dominant genes tend to express themselves more prominently than recessive ones. However, certain combinations can bring out recessive traits related to specific ethnicities. |
| Ethnic Markers in DNA Testing | These are specific sequences in DNA that are prevalent within certain populations, contributing significantly to their unique characteristics and identity. DNA testing can help identify these markers, hinting at diverse ethnic backgrounds even when not apparent through physical appearance alone. |
| Family History Exploration | Doing a deep dive into family history, including patterns of migration and intermarriage between different communities over generations might reveal unexpected sources of ethnicity not apparent from immediate ancestors. |
| Genetic Surprises at Birth | Many babies are sometimes born with features (like hair texture or skin color) not immediately matching those of their parents due to complex genetic interactions playing out over generations. |
The relationship between documented genealogy and genetic ethnicity estimates isn’t always straightforward. A family tree might show all ancestors from England for five generations, yet DNA results could indicate Scandinavian or French heritage from earlier migrations and intermarriages that paper records don’t capture.
Understanding the role of dominant and recessive genes in our ethnicity can significantly aid in comprehending how a child might exhibit ethnic characteristics different from those visible in their parents. While DNA ethnicity testing looks at genetic markers rather than physical traits, the same principles of inheritance apply.
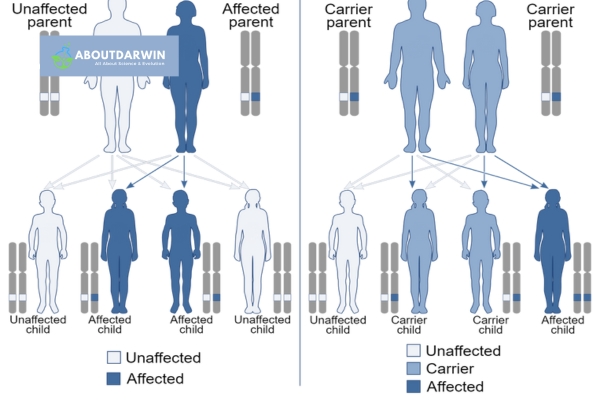
Our genetics form a kind of mosaic, with the pieces being combinations of dominant and recessive genes from previous generations. The interplay between these gene types helps explain why some ethnic traits skip generations while others appear consistently.
Dominant and recessive genes play a profound role when it comes to our physical features, some of which are often associated with specific ethnicities. These visible characteristics provide clues about underlying genetic ancestry even when they don’t appear in every generation.
These instances illustrate how genetic traits linked to specific ethnicity can come about due to the interaction between dominant and recessive genes hiding behind our DNA strands. The random combination of these genes at conception creates endless possibilities for variation.
There are cases where unexpressed or ‘silent’ recessive genes might surface unexpectedly alongside more prominently exhibited ethnic characteristics. In simple terms, there’s more than meets the eye when examining family genetics.
While genetics can offer surprising insights into our biological makeup, they form just one component of what shapes our broader understanding of ethnicity and personal identity. Cultural factors, personal experiences, and self-identification all play crucial roles in how we understand our heritage.
Genetic diversity from parents to children can sometimes lead to surprising results that illuminate the complex nature of ethnicity inheritance. The concept of ethnicity in genetics is intricate, so real-life examples and case studies play a pivotal role in demonstrating how these processes work in practice.

Here, we explore documented scenarios and anecdotal evidence that demonstrate how ethnicity percentages can vary between family members in ways that initially seem counterintuitive.
Anecdotes, while not standing as solid scientific proof, can indeed provide insightful illustrations of genetic inheritance’s quirky nature. These stories from real families help make abstract genetic concepts concrete and relatable.
Such anecdotes show us that our understanding of ethnicity based purely on outward appearances can sometimes be misleading due to the complexities inherent in human genetics. The random distribution of DNA segments creates endless possibilities for variation within families.
Evidence supporting unexpected ethnic diversity between parents and children doesn’t just stem from anecdotes; scientific studies are backing these observations with rigorous data analysis.
It is essential to recognize that while scientific understanding of genetics gives us useful insights into our connections with our familial or ethnic roots, human inheritance’s randomness opens up possibilities for surprising combinations. Remembering these examples should help us appreciate the tremendous diversity that makes up who we are.
Yes, a child can appear to have more ethnicity than one parent due to genetic recombination. While children inherit exactly 50% of their DNA from each parent, the specific segments they receive are randomly selected. If both parents carry small amounts of the same ethnicity, a child might inherit more segments associated with that region than either parent individually shows in their results. For example, if Parent A has 5% Scandinavian and Parent B has 3%, their child could show 6-8% through the genetic lottery of inheritance.
Siblings receive different ethnicity results because each child inherits a unique combination of their parents’ DNA. While siblings share approximately 50% of their DNA overall, the specific segments passed down differ dramatically. One sibling might inherit more DNA segments associated with their mother’s Irish ancestry, while another receives more segments linked to their father’s Italian heritage. This genetic shuffle means siblings can show significantly different ethnicity percentages despite having identical ancestral backgrounds.
A child cannot belong to an entirely different ethnicity than their parents, but they can display physical features associated with different ethnicities due to recessive genes and genetic variation. Physical traits like skin color, hair texture, and facial features result from complex interactions between multiple gene pairs inherited from both parents. When parents carry diverse ancestral backgrounds, children may express traits that seem distinct from either parent’s appearance, creating the impression of belonging to a different ethnic group while still sharing their genetic heritage.
DNA testing analyzes specific segments of your genetic code to identify your lineage and ancestors’ geographical origins. Companies compare your genetic markers against reference populations from around the world to estimate where your ancestors lived. Tests like autosomal DNA tests examine chromosomes 1-22 to reveal ancestry from the past 5-7 generations. This scientific approach can uncover ancestral connections that paper records miss, particularly for adoptees, descendants of enslaved people, or those with incomplete family documentation.
Commercial DNA tests have significant limitations for determining exact ethnicity percentages. Results represent statistical estimates rather than precise measurements, with confidence intervals often spanning several percentage points. Different companies use varying reference populations and algorithms, producing different results for the same person. Small percentages below 2% may reflect statistical noise rather than real ancestry. Additionally, reference panels are constantly evolving, meaning your results may change as companies update their databases and methodologies over time.
Your DNA results may differ from your parents due to the random nature of genetic inheritance combined with how testing companies interpret the data. During conception, you receive 50% of your DNA from each parent, but the specific segments are randomly selected through recombination. You might inherit more DNA segments associated with a particular ethnicity than either parent shows. Additionally, DNA testing companies periodically update their reference populations and algorithms, so parents who tested years ago may have different baseline results than children testing today, creating apparent discrepancies.
One percent DNA ancestry typically traces back approximately 6-7 generations, or roughly 150-200 years. At this percentage level, you likely have one ancestor from that ethnic region who lived around the early 1800s. However, 1% results should be interpreted cautiously as they often fall within the margin of statistical noise for DNA testing. Small percentages might represent real but distant ancestry, or they could reflect random genetic similarity to reference populations. Consider trace ancestry meaningful primarily when both parents also show small amounts of the same region, suggesting a consistent genetic pattern.
Also Read: Shared DNA for Cousins: Discover Your Genetic Links!
Understanding one’s personal identity involves far more than just examining genetic inheritance. The notion of a child having “more” ethnicity than their parents is largely dependent on how we define “ethnicity” and interpret DNA test results in 2026.
In genetics, one can bring forth unexpressed traits from previous generations due to DNA recombination and the existence of dominant and recessive genes, which may result in a seemingly greater variance in ethnicity. The random selection of genetic segments during conception creates situations where children show higher percentages of specific regions than either parent individually, though they cannot exceed the combined genetic contribution of both parents.
However, it is paramount to remember that commercial DNA tests present limitations that might not provide us with complete information about ancestry. Results vary between companies due to different reference populations and algorithms. Small percentages often represent statistical noise rather than meaningful ancestry. Moreover, cultural influences and personal experiences greatly contribute to labeling one’s ethnicity. The true beauty lies within this complexity—an intricate mosaic crafted by our diverse genes and life experiences. Whether you’re exploring your heritage out of curiosity or searching for specific ancestral connections, understanding the science behind ethnicity inheritance helps you interpret your results with both excitement and appropriate skepticism.