Physical Address
304 North Cardinal St.
Dorchester Center, MA 02124
Physical Address
304 North Cardinal St.
Dorchester Center, MA 02124

Have you ever received a DNA match notification and wondered exactly how this person connects to your family tree? Understanding shared DNA for cousins is one of the most powerful tools in genetic genealogy, yet it remains one of the most confusing aspects for beginners and experienced researchers alike. The numbers on your screen—whether displayed as percentages or centimorgans—tell a story that spans generations, revealing hidden branches of your family history.
In 2026, DNA testing has become more accessible than ever, with millions of people discovering relatives they never knew existed. Whether you are exploring your ancestry out of curiosity, trying to break through a genealogical brick wall, or searching for biological family members, knowing how much DNA cousins typically share can transform confusing match lists into meaningful family connections. This guide will walk you through everything you need to know about shared DNA percentages, from first cousins to distant fourth cousins and beyond.
What makes cousin DNA relationships particularly fascinating is the wide range of possible values. Unlike parent-child relationships that consistently share 50% of their DNA, cousin relationships can vary dramatically due to the random nature of genetic inheritance. This variability creates both opportunities for discovery and challenges for interpretation—challenges that become manageable once you understand the underlying science.
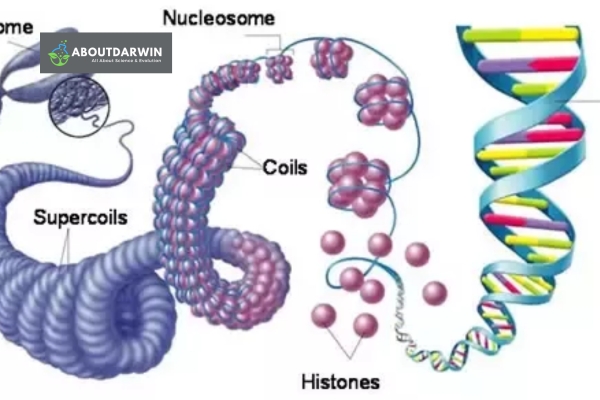
When we talk about shared DNA for cousins, we are referring to the amount of genetic material that two people inherited from common ancestors. This shared genetic material is measured through autosomal DNA testing, which examines the 22 pairs of chromosomes that everyone inherits from both parents. DNA testing companies like 23andMe, AncestryDNA, FamilyTreeDNA, and MyHeritage DNA analyze hundreds of thousands of genetic markers called SNPs (Single Nucleotide Polymorphisms) to identify matching segments between individuals.
The following comprehensive table shows the expected shared DNA percentages and centimorgan ranges for various cousin relationships. These values come from the Shared cM Project 4.0, which aggregates data from thousands of verified relationships:
| Relationship | Average Shared DNA | Average cM | Shared cM Range |
|---|---|---|---|
| First Cousin | 12.5% | 880 cM | 396 – 1,397 cM |
| Half First Cousin | 6.25% | 449 cM | 156 – 979 cM |
| First Cousin Once Removed | 6.25% | 433 cM | 102 – 980 cM |
| First Cousin Twice Removed | 3.125% | 221 cM | 33 – 471 cM |
| Double First Cousin | 25% | 1,760 cM | Varies widely |
| Second Cousin | 3.13% | 220 cM | 47 – 760 cM |
| Half Second Cousin | 1.56% | 110 cM | Variable |
| Second Cousin Once Removed | 1.56% | 109 cM | 0 – 352 cM |
| Third Cousin | 0.78% | 74 cM | 0 – 202 cM |
| Fourth Cousin | 0.20% | 20 cM | 0 – 78 cM |
| Fifth Cousin | 0.05% | 5 cM | Variable |
First cousins share an average of 12.5% of their DNA, which translates to approximately 880 centimorgans. However, the actual range can vary significantly from 396 cM to 1,397 cM. This wide range exists because first cousins inherit DNA from their shared grandparents through their parents, and the random recombination process means some cousins receive more DNA from the shared lineage than others.
When two siblings each have children, those children become first cousins. The genetic connection flows through the shared grandparents, with each parent passing down approximately half of their DNA to their child. Because recombination occurs differently in each parent, first cousins may share noticeably different amounts of DNA even within the same extended family.
Half first cousins share only one set of grandparents in common. This occurs when two siblings share only one parent (making them half-siblings), and each of those half-siblings has children. Half first cousins share an average of 6.25% of their DNA, or approximately 449 centimorgans, with a range typically between 156 cM and 979 cM.
Understanding half cousin relationships is crucial because many DNA matches fall in the ambiguous zone between full and half relationships. If you share around 6-7% of your DNA with a match predicted as a first cousin, you may actually be dealing with a half first cousin relationship rather than a full first cousin with low shared DNA.
The term “removed” indicates a generational difference between cousins. First cousins once removed share the same amount of DNA as half first cousins—approximately 6.25% or 433 cM on average. This relationship occurs when you compare a first cousin with your child, or when you compare yourself with your parent’s first cousin.
First cousins twice removed share approximately 3.125% of their DNA, averaging around 221 centimorgans. These relationships span two generations, such as comparing yourself to your grandparent’s first cousin or your first cousin’s grandchild. Understanding removed cousin relationships helps interpret matches that seem “off” by one generation in your family tree predictions.
Double first cousins occur when two siblings from one family marry two siblings from another family. The resulting children share both sets of grandparents, making them genetically equivalent to half-siblings. Double first cousins share an average of 25% of their DNA—approximately 1,760 centimorgans—which is the same amount shared between half-siblings, grandparents and grandchildren, or aunts/uncles and nieces/nephews.
This relationship is relatively rare in modern Western societies but was more common historically when marriage pools were smaller. If you see a match sharing around 25% DNA, do not immediately assume they are a half-sibling—they could be a double first cousin or another close relative relationship.
Second cousins typically share about 3.13% of their DNA, or approximately 220 centimorgans. They descend from common great-grandparents but through different grandparent lines. The Shared cM Project indicates second cousins can share anywhere from 47 cM to 760 cM, demonstrating significant variability even at this relationship level.
Third cousins share approximately 0.78% of their DNA, averaging 74 centimorgans with a range of 0 to 202 cM. Notably, third cousins have about a 10% chance of sharing no detectable DNA at all due to the random nature of inheritance over multiple generations. Fourth cousins average only 0.20% shared DNA (about 20 cM), with a high probability of not matching at all.
Also Read: How to Get DNA Matches Without Trees? [Expert Guide]
The amount of shared DNA varies due to several factors beyond the simple degree of relationship. Understanding these factors helps explain why your DNA matches might not align perfectly with theoretical averages and why some predicted relationships seem ambiguous.
Genetic recombination occurs during meiosis, the process of cell division that creates sperm and egg cells. During this process, chromosomes exchange segments of DNA, creating unique combinations in each gamete. This shuffling mechanism means that siblings inherit different portions of their parents’ DNA, even though they receive the same total amount.
When recombination happens differently in two siblings who become parents, their children (the cousins) will share varying amounts of DNA from the common grandparents. This explains why first cousins can share anywhere from 396 cM to 1,397 cM—a nearly fourfold difference—despite having the same theoretical relationship.
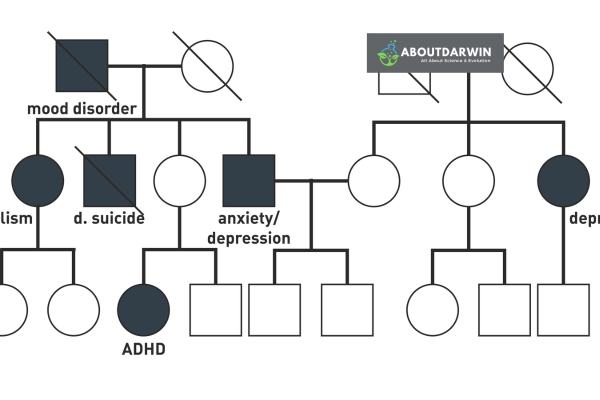
Ancestral backgrounds significantly influence shared DNA amounts. When individuals come from the same ancestral population or geographic region, they may share more DNA than expected due to pedigree collapse—where distant ancestors appear multiple times in a family tree. This phenomenon, known as endogamy, is common in isolated communities, certain religious groups, and populations with limited migration.
For example, cousins with Ashkenazi Jewish, Amish, or Pacific Islander ancestry often share elevated amounts of DNA due to centuries of intermarriage within relatively small population groups. When analyzing DNA matches from endogamous populations, shared amounts may suggest closer relationships than actually exist because the shared DNA comes from multiple ancestral lines rather than a single recent common ancestor.
Beyond total shared DNA, the pattern of shared segments provides important clues about relationships. Closer relatives share longer contiguous segments of DNA, while distant cousins typically share only small fragments. A first cousin might share 20-30 segments averaging 30-40 cM each, whereas a fourth cousin might share only 1-2 segments of 10 cM or less.
Triangulation—the process of confirming that multiple matches share the same DNA segment from a common ancestor—adds another layer of verification. When three or more cousins share the identical DNA segment, it confirms they inherited that segment from the same ancestor, increasing confidence in the predicted relationship.
Also Read: What is DNA Ethnicity Estimates? Learn Your Heritage
Estimating relationships from shared DNA requires understanding both the amount of genetic material shared and how DNA testing companies interpret these values. The process combines statistical analysis with an understanding of the variability inherent in genetic inheritance patterns.
Centimorgans (cM) represent the standard unit for measuring shared DNA in genetic genealogy. Unlike percentage measurements which can vary slightly between testing platforms, centimorgans provide a consistent metric based on the probability of recombination between genetic markers. One centimorgan roughly corresponds to a 1% chance of recombination occurring between two points on a chromosome during meiosis.
The Shared cM Project, maintained by genetic genealogist Blaine Bettinger, provides the most comprehensive database of verified relationship data. Version 4.0 of the project incorporates statistics from over 60,000 known relationships, offering robust averages and ranges for interpreting your DNA matches. Here are the detailed centimorgan statistics for cousin relationships:
One of the most challenging aspects of genetic genealogy is that different relationships can produce identical shared DNA amounts. For example, half first cousins and first cousins once removed both average around 6.25% shared DNA (approximately 440-450 cM). Similarly, a first cousin sharing on the low end (around 400 cM) might be indistinguishable from a half first cousin sharing on the high end.
This ambiguity requires genealogists to use additional evidence beyond total shared cM. Age differences between matches can provide clues—if your match is significantly older or younger, they might be from a different generation (removed cousins). Shared matches (also called “in common with”) can reveal whether you connect through one grandparent line or both. The longest shared segment length also helps distinguish relationships, with closer relatives sharing proportionally longer segments.
DNA testing companies like 23andMe, AncestryDNA, FamilyTreeDNA, and MyHeritage DNA use proprietary algorithms to predict relationships based on shared DNA. These predictions combine the total shared centimorgans, the number and length of shared segments, self-reported ages or birth years, and in some cases, shared matches to other known relatives.
AncestryDNA introduced relationship probability percentages in recent years, showing the likelihood of various possible relationships for each match. For a match sharing 850 cM, AncestryDNA might indicate 60% probability of first cousin, 30% probability of half first cousin or first cousin once removed, and 10% probability of other relationships. These probabilities help users understand the inherent uncertainty in DNA relationship prediction.
23andMe displays relationships with labels like “First Cousin” along with a predicted relationship range and the percentage of shared DNA. Their system also shows whether you share fully identical regions (indicating you match on both copies of a chromosome, typical of full siblings) or half-identical regions (indicating a single shared segment, typical of other relationships).
Understanding these company-specific approaches helps interpret your match list more accurately. No prediction system is perfect, and all companies face the same fundamental challenge: DNA amounts overlap between different relationship types, making definitive classification impossible without additional genealogical evidence.
Also Read: Can DNA Tests Put Your Personal Information at Risk?
First cousins typically share 12.5% of their DNA, or about 880 centimorgans. Second cousins share approximately 3.13% (220 cM), and third cousins share about 0.78% (74 cM). However, these are averages—the actual amount can vary significantly due to genetic recombination. First cousins can share anywhere from 396 to 1,397 cM, while second cousins range from 47 to 760 cM.
Cousins share 12.5% because of how DNA passes down through generations. First cousins have shared grandparents. Each parent passes roughly 50% of their DNA to their child. The cousins receive DNA from their shared grandparents through their parents, but due to random recombination during inheritance, they only inherit overlapping segments about 12.5% of the time on average. This percentage halves with each generation: second cousins share about 6.25% from their shared great-grandparents, third cousins about 3.125%, and so on.
Full first cousins cannot share 25% DNA—that amount typically indicates a closer relationship like half-siblings, grandparents and grandchildren, or aunts/uncles and nieces/nephews. However, double first cousins (when two siblings marry two siblings from another family) do share approximately 25% of their DNA. This rare relationship creates children who share both sets of grandparents, making them genetically equivalent to half-siblings rather than typical first cousins.
No, first cousins always share some DNA. The lowest verified first cousin match in the Shared cM Project is 396 cM (about 5.6%). The random nature of genetic recombination makes it statistically impossible for first cousins to share zero DNA. However, starting at the third cousin level, there is approximately a 10% chance that two third cousins will not share detectable DNA. By fourth cousins, the probability of not sharing DNA increases to around 50%, and fifth cousins or more distant relatives often share no detectable genetic material.
A 12% DNA match is unusually high for a second cousin but not impossible. Second cousins typically share about 3.13% (220 cM), with a range of 47-760 cM (roughly 0.7% to 11%). A 12% match (approximately 850 cM) falls at the extreme upper range and would be statistically rare. Such a high percentage might indicate that the relationship is actually a first cousin once removed, half first cousin, or that endogamy (intermarriage within a population) is causing elevated shared DNA from multiple ancestral lines.
Cousin DNA testing is highly accurate at detecting biological relationships, but the predicted relationship category may require interpretation. DNA tests can reliably detect whether someone is related to you, but distinguishing between relationships that share similar DNA amounts—like half first cousins versus first cousins once removed—requires additional genealogical research. Testing companies provide probability ranges rather than definitive answers. The accuracy of relationship prediction improves when combining DNA data with documented family trees, age information, and shared match analysis.
DNA testing companies predict relationships based on statistical probabilities, and overlapping DNA ranges create ambiguity. A match sharing 450 cM could be a half first cousin, first cousin once removed, or even a more distant relationship in an endogamous population. Companies use algorithms that consider shared DNA amount, segment lengths, ages, and shared matches. If your known first cousin is predicted differently, it is usually due to sharing an amount at the edge of typical ranges. Additional analysis using shared matches and family tree information can clarify the true relationship.
A half first cousin shares only one set of grandparents with you. This happens when your parent and their parent are half-siblings (sharing only one parent). Half first cousins share approximately 6.25% of their DNA on average (about 449 cM), which is exactly half what full first cousins share. This relationship is often confused with first cousins once removed because they share similar DNA amounts. The key difference is generational: half first cousins are in the same generation, while removed cousins are from different generations.
‘Once removed’ indicates a one-generation difference between cousins. Your parent’s first cousin is your first cousin once removed. Similarly, your first cousin’s child is also your first cousin once removed. These relationships share about 6.25% DNA (433 cM on average)—similar to half first cousins. ‘Twice removed’ means a two-generation gap, such as your grandparent’s first cousin or your first cousin’s grandchild, sharing approximately 3.125% DNA (221 cM). The removed designation helps clarify where a match fits in your family tree when they are not from your exact generation.
DNA testing can reliably detect third cousins (sharing great-great-grandparents) about 90% of the time, though some third cousin pairs share no detectable DNA. Fourth cousins are detected roughly 50% of the time, and fifth cousins or more distant relatives are increasingly unlikely to appear as matches. The practical limit for reliable cousin detection is generally considered fourth or fifth cousins, though anecdotal matches at greater distances do occur. Autosomal DNA testing becomes less reliable beyond 6-7 generations due to DNA dilution, though Y-DNA and mitochondrial DNA tests can trace paternal and maternal lines much further back.
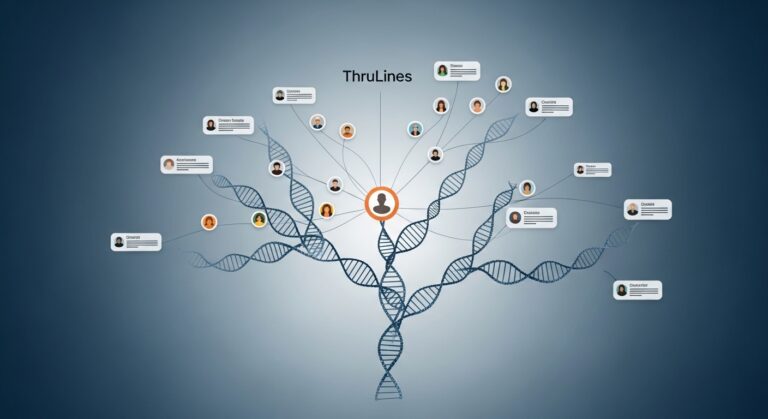
Determining relationships through shared DNA becomes much easier with the right tools and resources. Whether you are trying to figure out how a match connects to your family tree or working through a complex genealogical puzzle, these resources provide invaluable assistance for interpreting shared DNA for cousins.
Also Read: Shared DNA Matches: A Guide to Discovering Family Connections
Understanding shared DNA for cousins opens a fascinating window into your genetic heritage and family history. Whether you are puzzling over a match that shares 450 cM (half first cousin or first cousin once removed?), trying to identify a biological parent through shared matches, or simply curious about your genealogical connections, the knowledge in this guide provides a solid foundation for interpreting your results.
Remember that DNA is a tool for genealogical discovery, not a definitive answer on its own. The overlapping ranges between relationship types mean that shared DNA amounts provide probabilities rather than certainties. Combining your genetic data with traditional genealogical research—building family trees, examining shared matches, and documenting connections—will yield the most accurate understanding of how you relate to your DNA matches.
As DNA testing technology continues to improve and databases grow larger, our ability to identify and understand cousin relationships will only get better. The tools and resources available today, from the Shared cM Project to DNA Painter, have revolutionized genetic genealogy in 2026, making it possible to solve family mysteries that would have been impossible just a decade ago. Embrace the journey of discovery that your DNA results offer—each match is a potential connection to a new branch of your family story waiting to be explored.